Updated Methodology for Calculating Inventory (Months of Supply)
We're improving how Inventory is calculated. From the next data release (1st of May 2026), the metric will use accumulated Stock on Market rather than new listings only.
What's changed
Previously, Inventory was calculated using new Stock on Market — only listings that entered the market within the calendar month were counted, with no carry-over from prior periods. The reasoning behind this is documented in detail in our Stock on Market methodology article.
Inventory is now calculated using cumulative Stock on Market: current month listings plus all prior-month listings still active at the end of the calendar month.
Why we're making the change now
The original (non-cumulative) approach was chosen because our time series began shortly before the COVID boom, when demand was consuming stock across the country and inventory trends were heavily skewed by that event. Using a cumulative method against that baseline to present metric trends would have produced misleading results.
Now that we're well past that period, the cumulative method gives a truer read of supply conditions.
What you'll see on the charts
Higher values in both the time series and the latest month figure. This is by design.
A hump toward the end of the series. Listings tend to accumulate — sale listings can remain active for up to six months — so cumulative readings naturally trend higher in recent months. This is exactly why Stock on Market itself remains a new-listings metric: to keep that hump out of momentum analysis.
Trends may appear to reverse in some markets. Accumulated values are inherently higher month-on-month, so the shape of the curve will look different. This is a methodology effect, not a market signal.
Impact on filtering and analysis
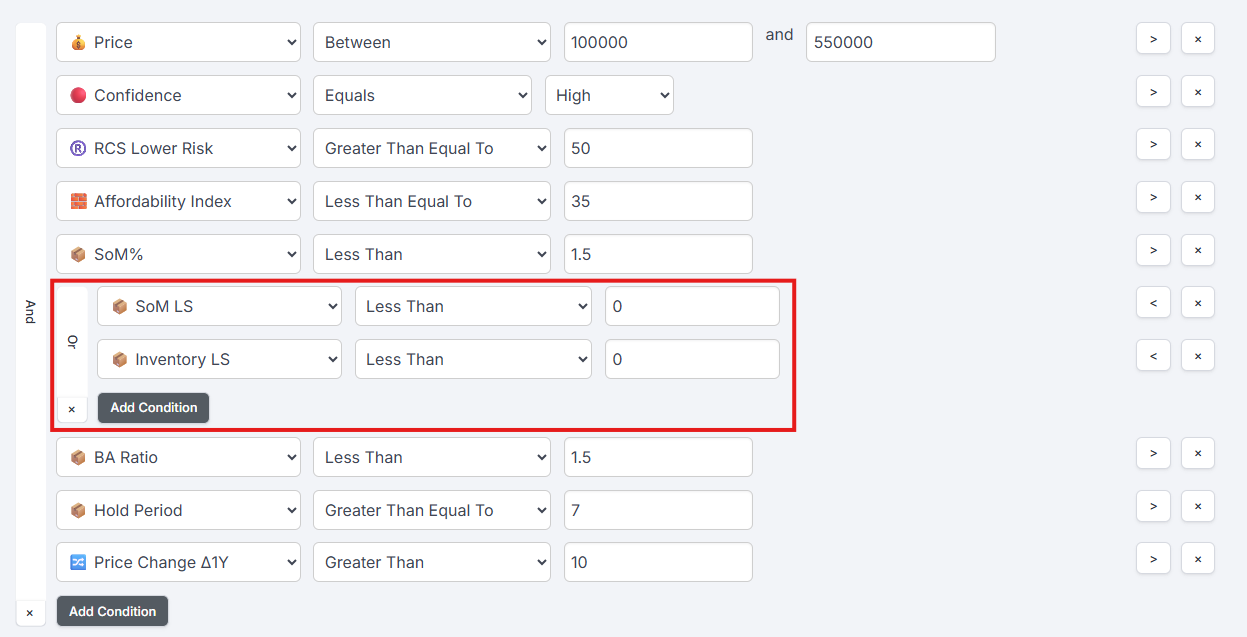
No impact. The recommended filtering approach is unchanged: Inventory LS should be used as a nested condition alongside Stock on Market Percentage. The standard filter combination remains:
Stock on Market long-term trend (LS) < 0 OR
Inventory long-term trend (LS) < 0
If either one or both are trending down, the supply-tightening condition still applies.
Why the two metrics together are more powerful now
You now get two complementary views of supply:
Stock on Market % — the momentum view. New listings entering the market each month, uncontaminated by accumulated stock.
Inventory — the cumulative view. Total active stock available at any point in time.
Combined, they give you the full picture: how much fresh supply is hitting the market and how much is sitting on it.
Unchanged
Threshold bands (favourable, neutral, unfavourable) remain as published in the data dictionary. Please refer to the data dictionary for the ranges.
Current month value is still reported as a 3-month moving average, consistent with how current month values are presented for other metrics.