New Feature: Property Listings on StreetLens™ Heatmaps
StreetLens™ heatmaps across the HTAG Analytics platform now include property listings, available exclusively to professional and elite subscribers.
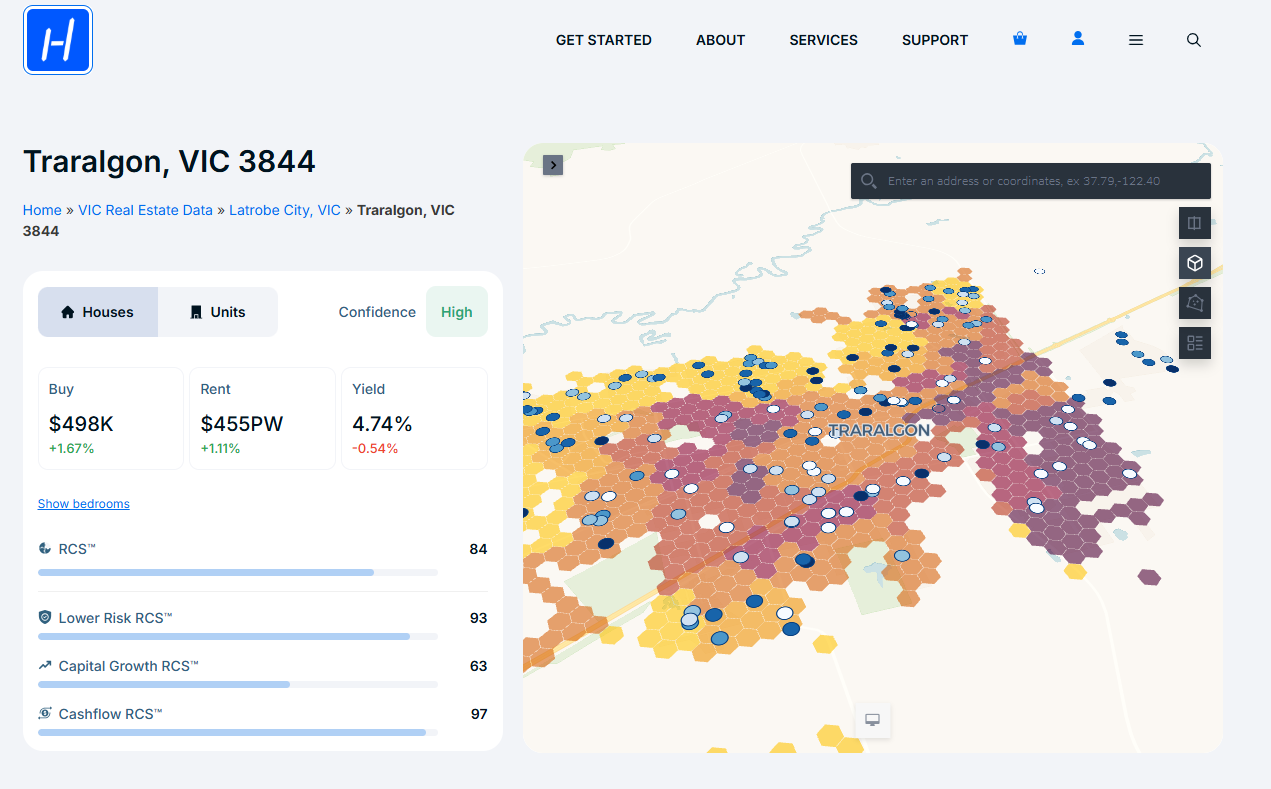
Default Layer Updates
Previous: CMA (Comparative Market Analysis) price hexagon
New: IRSAD (socio-economic index) hexagon combined with property listings
Note: IRSAD is just the default layer - you can overlay listings on any of the 20+ available layers
Simplified default filters for better usability:
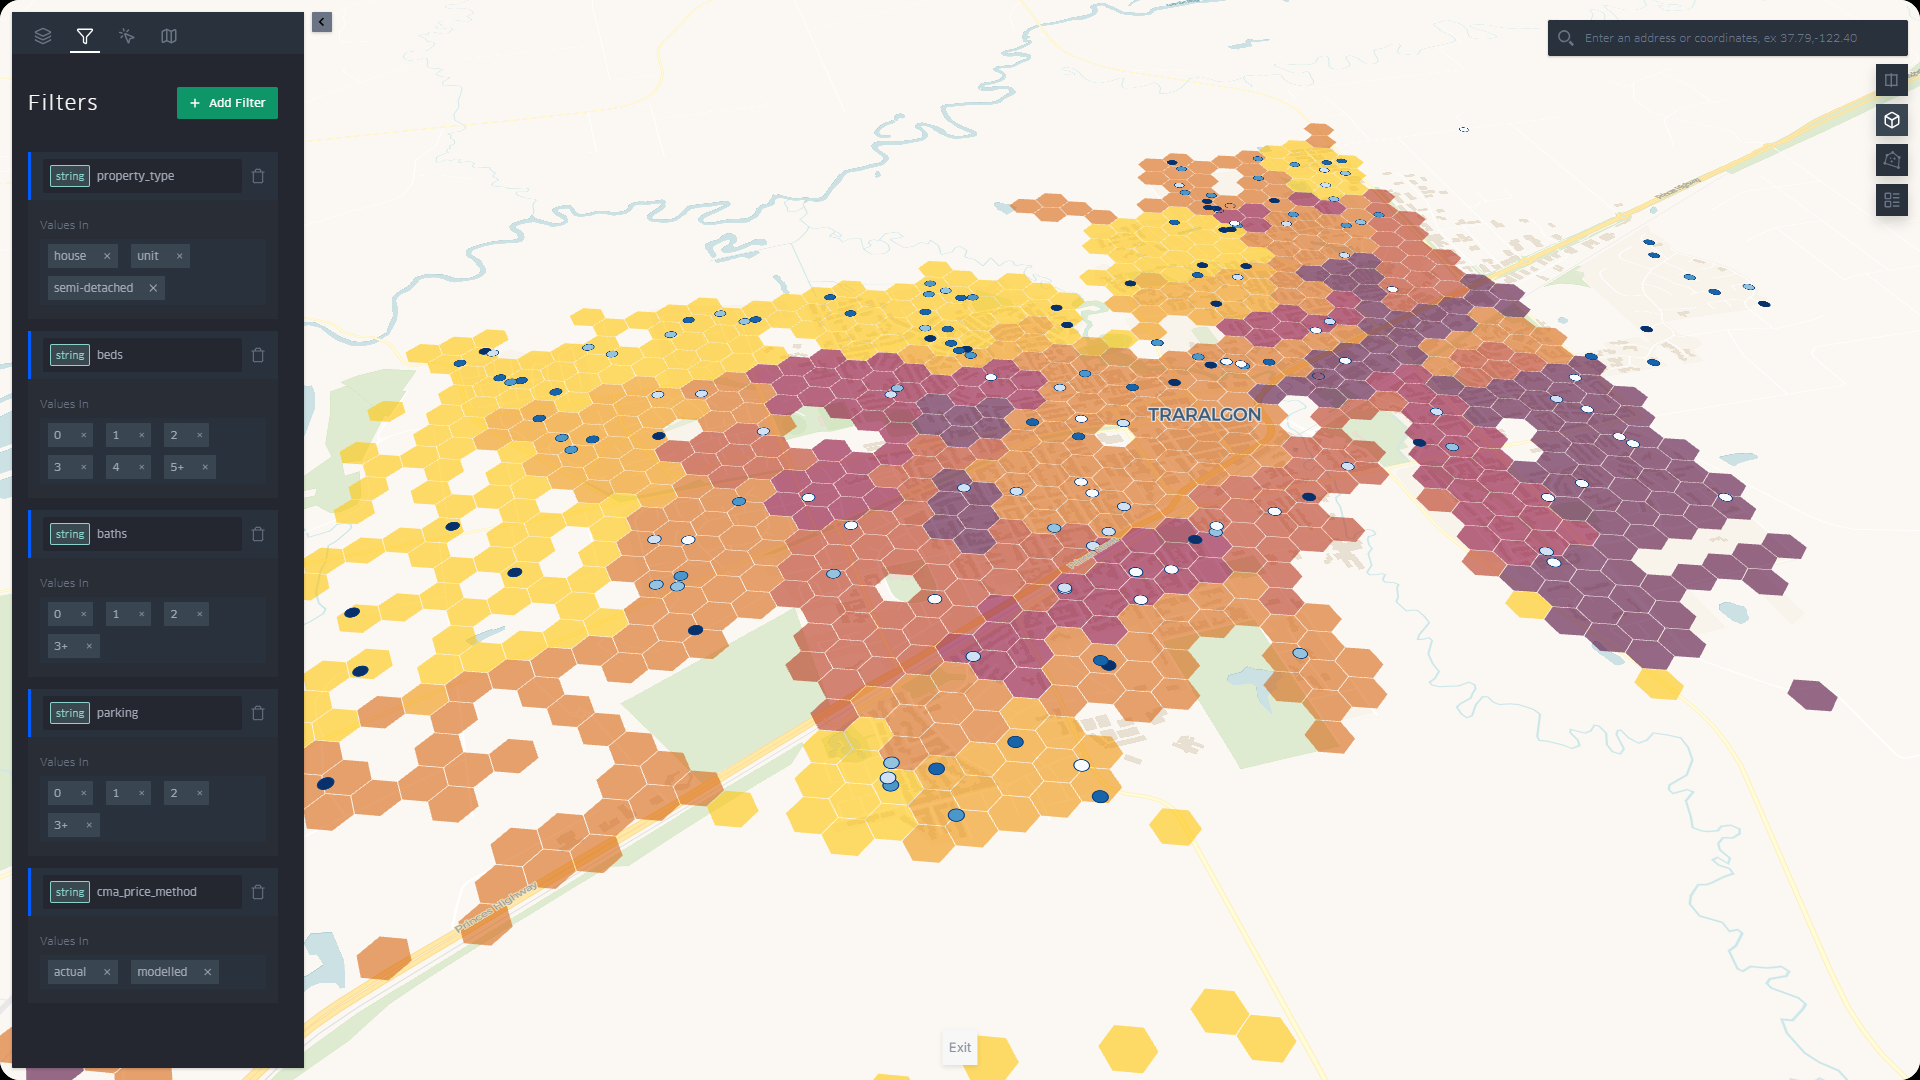
Listing Features
Color coding: Dark blue for high prices, lighter blue for lower prices
Uncolored pins: Properties without published prices
Daily updates: Listings refresh once per day
Direct links: Each listing includes a Google search link for the property address
Compare mode: Pin a listing and compare it with other listings on the heatmap
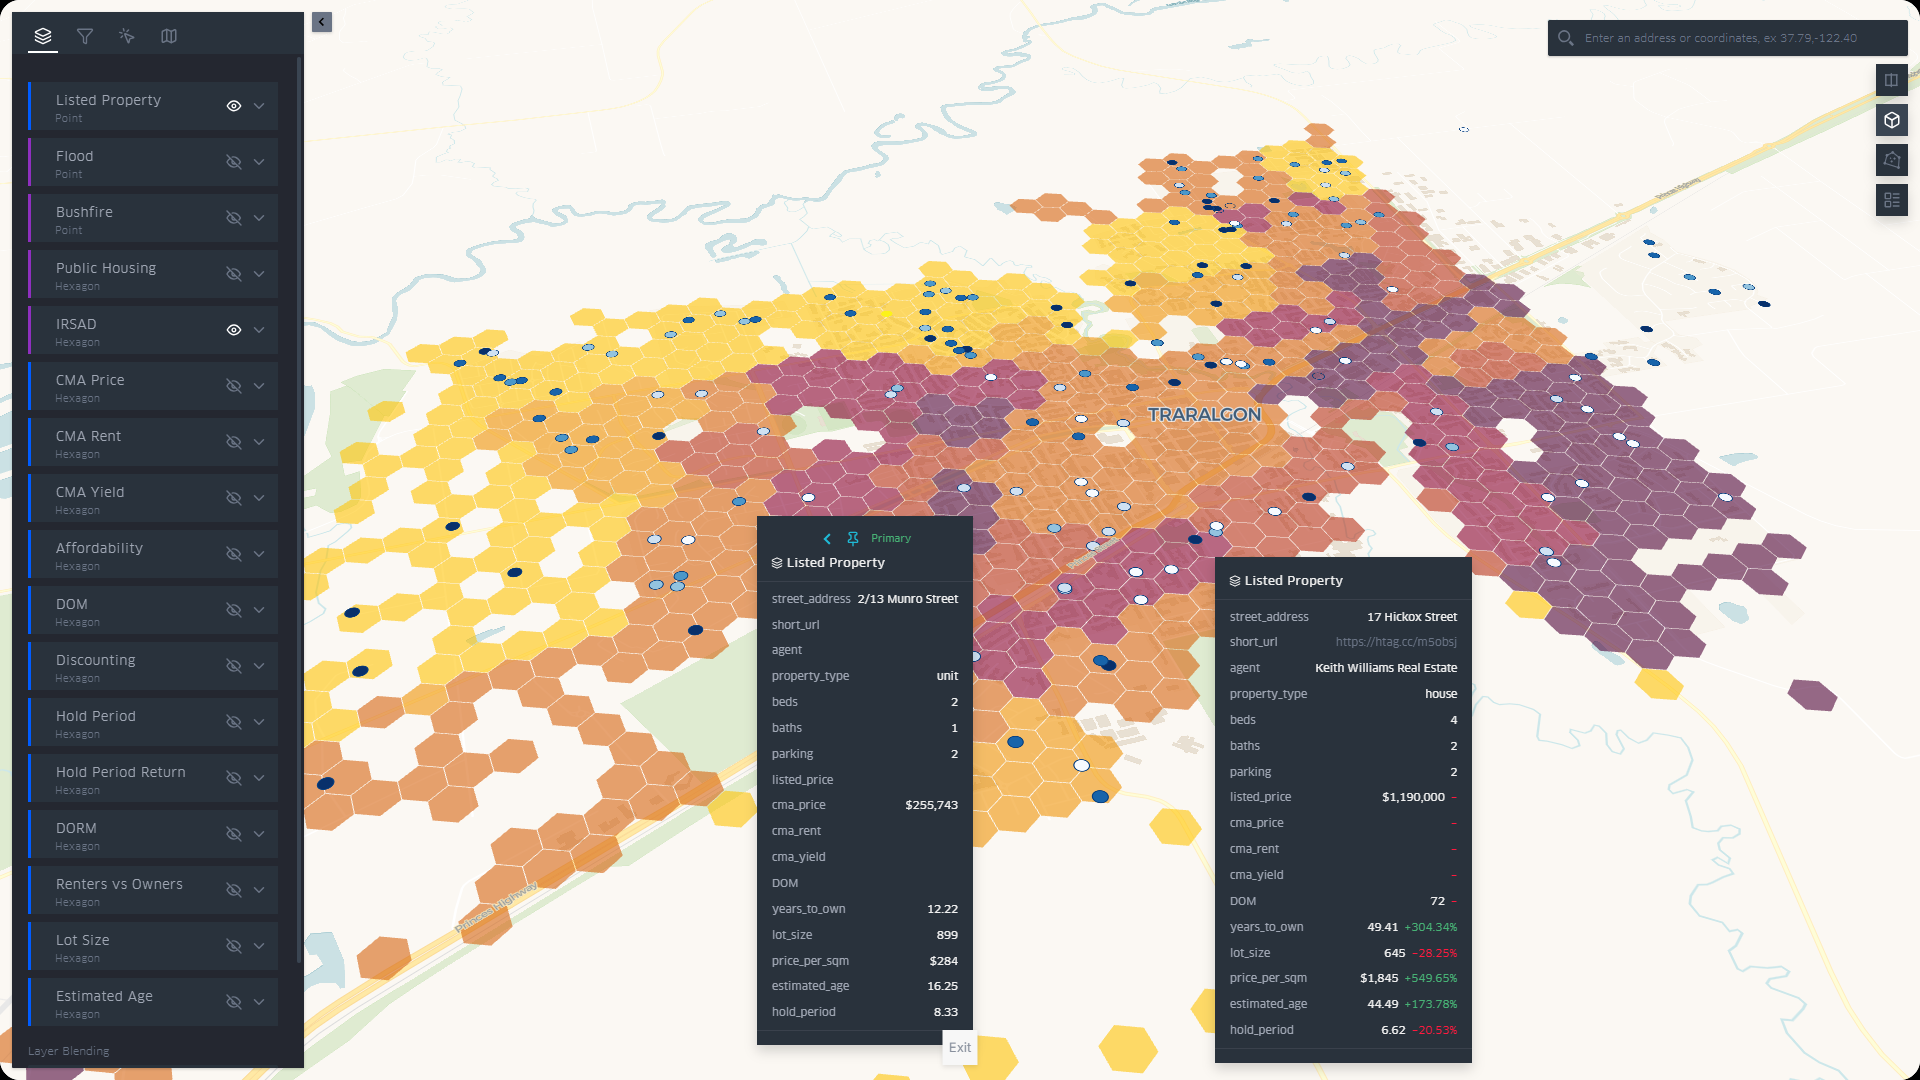
The Google search functionality prevents over-reliance on single listing portals. Some properties are only listed on specific portals, so this approach ensures you can find listings across all available platforms.
Strategic Workflow Enhancement
Use heatmaps in full screen mode for optimal experience. Follow a two-step process:
Identify favourable areas in a suburb using the IRSAD or a combination of any of the 20 layers avaiable to find pockets ranking high on your desired parameters
Focus on specific listings within these high-potential areas
Need a Detailed QDex Overview?
If you haven’t yet, be sure to watch the #Intro to StreetLens™ Heatmaps demo for a detailed review of all QDex features.
Getting Started
Professional and elite subscribers can access these new features immediately through existing HTAG Analytics suburb dashboards. The enhanced QDex heatmaps maintain all existing functionality while adding these powerful new visualization and analysis capabilities.
If you still see the old heatmap view, hit Ctrl+Refresh in your browser (or use the Apple equivalent Command (⌘) + Shift + R) to load the new features.